KPIs for early-stage startups are often neglected by founders who focus on product development and team building. KPIs are one of the most important things to monitor when transitioning from a product idea to building an early-stage startup.
KPI meaning
KPIs are individual units of measurement that provide windows into the performance of a business various departments and initiatives.
KPIs provide the most important performance information that enables organisations to understand whether or not the organisation is on track toward its stated objectives.
KPIs are used to track the operational performance of departments, projects or individuals for targetted goals. They can provide a management tool for gaining insight and decision making.
KPIs come in distinct variations and need to be thoughtfully reflected in the context of the individual business circumstances.
- The type of customers your startup serves
- the type of product your business commercializes
- Choose KPIs that are directly related to your business goals
- Consider your company’s stage of growth
- Identify both lagging and leading performance indicators
- KPIs are different for every industry and business model
Startup KPI Dashboard:
Setting and analyzing performance indicators for your company is the best way to forecast and get on track with your business goals. There are different types of KPI’s available to managers, who have a choice to make from what and when to use depending on the needs and planning of the company.
15 top SaaS KPIs:
Growth Metrics KPIs for startups
1. Customer Churn
It measures how much a business has lost over a period of time. It is one of the most important metrics in tracking the day-to-day vitality of your business.
Being a startup the focus is on revenue growth. In order to attain this, your goal should be to earn more customers thereby creating a negative revenue churn.
The important task here is to prevent paid customers to unsubscribe while finding ways to retain the existing customers. keeping customers is as important as acquiring new ones.
Identify the user personas of the churned customers to know why they failed to renew or drop out.
To calculate churn, you must use data from your accounting or billing and/or CRM software. Ideally, these platforms should be integrated, so that you can cross-check and pull data from either place
Churn Rate = ( Users at Beginning of Period – Users at End of Period ) / Users at Beginning of Period
Tracking churn rates can save your business from a complete disaster.
2. Qualified Marketing Traffic
It’s the number of users visiting your website. Use this metric along with the source of traffic, to know more about how effective you paid or SEO campaigns are.
Most of the SaaS websites have a log-in link on their site. With the cloud-based solution, the customers need to log in which means they need to revisit the website. As your app users increase, so will your overall traffic.
This can yield false data, ultimately showing higher traffic growth due to marketing initiatives, which may not be the case.
It’s important that you track the returning number of customers separately, as they can increase your traffic numbers. As a marketer, it is important to keep a track of the number of visitors that are already a customer and which are qualified marketing traffic.
With this differentiation, you can set the actionable traffic KPIs and build a solid traffic-generation plan.
You can use simple tools like Google Analytics to get accurate data.
3. Monthly new leads
If you seek qualified prospects, you will need to focus on metrics related to leads. This metric reflects the size of your accumulated audience, and it also shows the overall effect of your marketing efforts.
For SaaS companies in their startup stage, the number of signups per month is probably the most important growth metric, since they’re still building up their user base.
Google Analytics can help you with calculating some of the SaaS KPI’s such as new leads and comparing data to the previous month.
Conversion metrics KPIs for startups
4. Leads to Customer
This number describes how many leads convert into paying customers per month. In other words, it shows whether your sales process and lead-nurturing methods are working or not.
Take your total number of customers for any given month, divide it by the total number of leads, and multiply that number by 100.
Use Google Analytics goals to track conversions and other paid tools which can come in handy, like BigRadar.
The lead-to-customer rate is about how fast you’re turning free subscribers into customers.
5. Visitor to lead rate
This shows how you are turning traffic into an actual business opportunity.
How to calculate the visitor-to-lead rate. Take your total number of people that converted to leads for any given month, divide it by the total number of unique visitors, and multiply the result by 100.
Marketing and other basic KPIs for SaaS startups
6. Customer Engagement Score
If a brand is engaged with its customers and those customers are satisfied with that engagement, they are going to visit more, buy more, and share.
Each company’s customer engagement score scale will be different depending on how a typical customer or user uses your software.
3 key metrics that show you how to measure customer engagement:
- Activity Time
- Visit Frequency
- Core User Actions
Create your own customer engagement score with a list of inputs that predict a customer’s happiness and longevity by starting with looking at your happiest, longest-standing customers
7. Customer acquisition cost
Customer acquisition cost measures the cash that a SaaS business burns to acquire new customers and indicates how long it will take a company to acquire the initial investment used to capture those customers.
Be generous and include all costs that you should allocate to your sales and marketing functions.
To calculate CAC, divide your total sales and marketing spend by the total number of new customers you add during a given time.
CAC = Total Cost of Sales & Marketing / Number of Deals Closed
If you begin with calculating CAC for a single month, you might not be able to include the sales cycle which can be longer in case of a SaaS product.
8. Monthly recurring revenue
This is a single and recurring figure you need to track regardless of the number of billing cycles and pricing plans. Tracking MRR can keep a SaaS company’s management team from falling into the trap of obsessing over long-term contractually booked sales.
It is a powerful metric that tracks the net value of renewals, a new subscription, and up-sells minus churns every month.
MRR helps the SaaS startup KPIs predict the future of the business. Therefore MRR can also be effective to evaluate the value it brings to the table for a funding round.
This is the total revenue billed monthly. You should pull this straight from your billing system.
9. The average revenue per account
It is measured as Average Revenue per Customer/Account. It Depicts the average revenue per customer since a customer should be signed up for a single account.
You can estimate your ARPA by calculating the aggregate MRR generated by the month-end and divide the result by the total number of active users at that period.
ARPA = MRR / Total Number of Customers
Expenses metrics KPIs for startups
10. Months to Recover CAC
The metric shows how quickly a customer begins to generate ROI for your business. And you would want the number to get smaller over time as the business grows.
To calculate this metric = CAC / MRR x GM
11. CAC:LTV Ratio
CLV-to-CAC shows the lifetime value of your customers and the total amount you spend to acquire them.
In order to calculate the ratio between the two, simply compare them. A healthy business has a CLV which is at least 3 times greater than CAC. If it’s low beyond this you spending too much money and above this, you’re spending too little and probably missing out on business.
12. Monthly expenses
The two main categories of expenses are the costs of goods sold (COGS) and operating expenses. Both categories of expenses are important for analytics, benchmarking, and investor analyses.
In tech startups, these expenses tend to be high. Managing them is important.
13. Operating expenses
Operating expenses are those costs incurred by an organization through its day-to-day business operations.
It includes salaries, rent, advertising, legal & professional fees, etc. Your accountant will be able to help you with the appropriate cost structure for your SaaS startup.
Other marketing metrics KPIs
14. Leads by Lifecycle Stage
The sales cycle will depend on the type of product, the reputation of the product, and the price tag. It can get difficult to work with a new product and create a buzz in the market. The sales process for SaaS products can range anywhere from a few days to close to a year.
The leads can be subcategorized:
- Marketing qualified lead (MQL): Refers to a lead that is more likely to become a customer compared to other leads based
- Sales qualified lead (SQL): This means that the sales team has qualified this lead as a potential customer.
These category helps to identify if and where leads might be getting stuck in the funnel. Knowing this can provide great insight into lead-nurturing opportunities and even guide sales follow-ups appropriately.
15. Cost-to-Service
Using a customer service tool that involves predictive analytics is critical to building and maintaining a customer base. If you want to stop customers from churning, you need to use data to work proactively to prevent it.
For a SaaS company, the ongoing cost of running a service is the key to profitability.
A KPI dashboard for early-stage SaaS startups (Example)
Department based KPIs:
- Sales KPIs
- Marketing KPIs
- Financial KPIs
- HR KPIs
- Customer Service KPIs
- Health & Safety KPIs
- IT KPIs
- Change Management KPIs
What is Leading and Lagging KPIs?
Leading and lagging indicators are two types of measurements used when assessing performance in a business or organization.
KPIs must be actionable to be insightful and of an operational value. one needs to reflect on the time aspect of a particular KPI:
Leading KPIs: Indicate to you the future business performance
Lagging KPIs: This indicator measures an output of something that has already happened.
Leading indicators include the following:
- % Growth in Sales Pipeline
- % Growth in New Markets
- Number of New Patents
- The Number of New Website Trials
- Number of Unique Website Views
Lagging indicators include the following:
- Annual Sales
- Growth in Annual Sales
- Gross Margin
- EBITDA
- Annual Net Income
- Growth in Annual Net Income
What is different between both the approaches:
Leading indicators are important for building a broad understanding of performance because they provide information on likely future outcomes. Leading indicators are as to what might happen, not what definitely will happen.
The lagging indicator is probably not telling you why this trend is happening and what you can do to stop it. lagging indicators encourage a focus on outputs rather than outcomes. These types of metrics are good for purely measuring results.
Leading KPIs are used to predict changes or trends, as well as forward-looking and help to manage the performance of a system or process.
Lagging indicators are used to determine how well a process or system was managed.
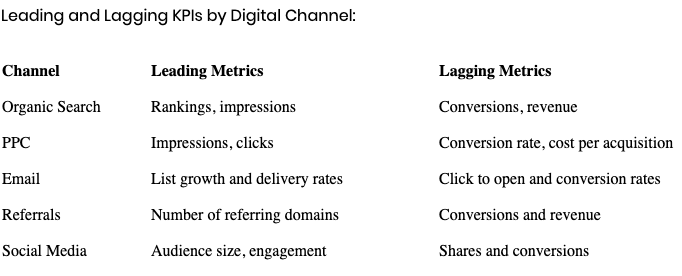
Examples of Lead and Lag Measures:
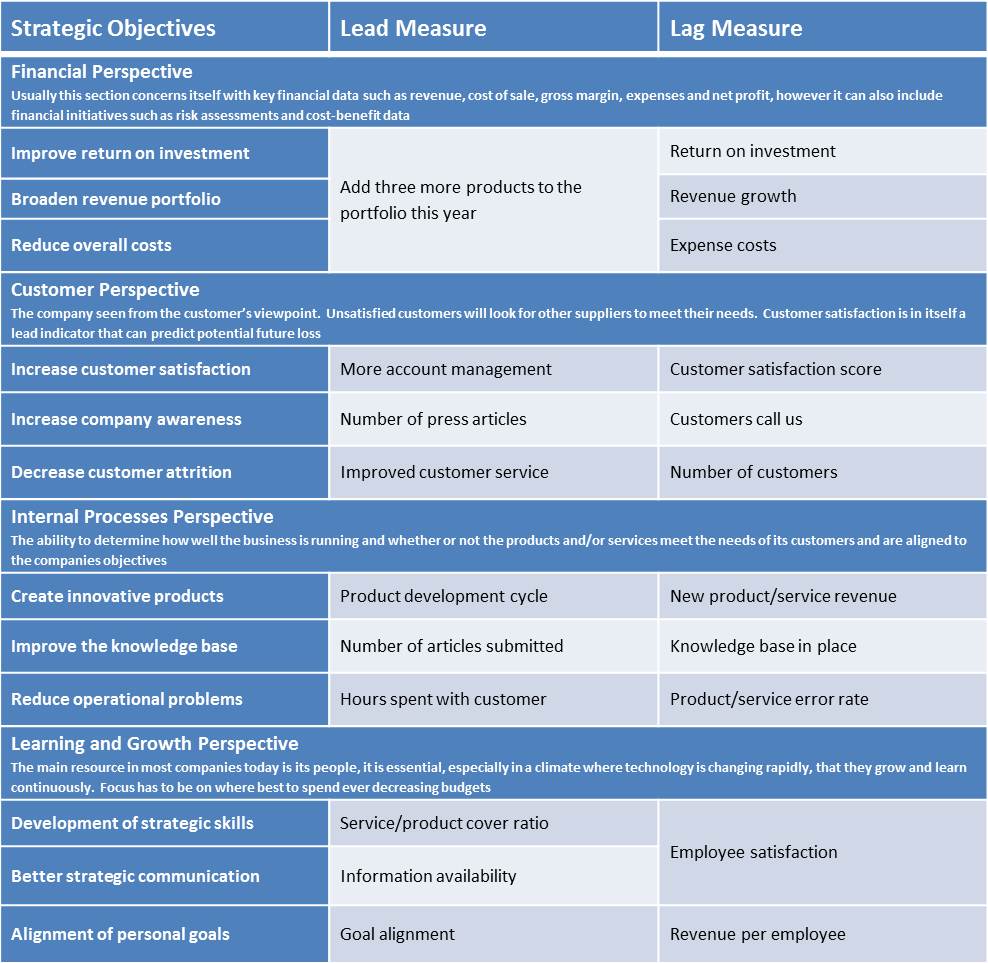
Regardless of whether the KPI is leading or lagging, it is important that the information is described by the KPIs, are acted upon. Because if they are not, there is no point in measuring them.
It’s also worth noting some indicators can be both leading and lagging.
Lagging indicators are an important resource for creating leading indicators that can launch your business into growth mode, but that’s not enough. In order for the metrics to work best in tandem to produce the most accurate and achievable KPIs.
The bottom line is if you’re using lagging indicators without leading indicators, you’re only getting half of the KPI picture.
How to create KPIs for a business?
KPIs help an organization, department, team or manager react instantly to any events that might impact the business. Organizations use KPIs at multiple levels to evaluate their success at reaching targets.
KPIs will only deliver mission-critical data if you use the KPIs and analyze what they tell you on a regular basis to inform your decision making.
- Define your Business Goals
Start acts as a starting point for designing appropriate KPIs. A KPI needs to be intimately connected with a key business objective.
Strategic Objective: Increase the flow of the marketing pipeline. ****
A KPI could be related to your business goal of increasing conversions on the product page, improving the return on investment of your marketing efforts, or improving customer service.
Firstly, You need to analyze the strategic goals of the company and the department for the next few years. Then, analyze your company’s operational goals or marketing goals for the near future.
2. Outline the criteria for success
If the objective states to increase the flow of the marketing pipeline, the success will depend on the increase in the number of contacts that enter the pipeline. This increase in the number of contacts will lead to the end of the pipeline and get handed over to Sales.
Targets should be realistic, changes to business processes take time to implement.
3. Collect the data
Investigate the availability and accuracy of the data. Collect all the data at one place to evaluate.
4. Build the KPI formula
Build formulas and create calculations with test data to see if the results are what you would expect. You will want to use various platforms and tools across your business to measure your KPIs. Having a central location to track and view all your departmental and organizational KPIs will ensure you have a clear view of your success.
5. Present your KPIs
It’s always wise to think about how best to communicate your KPIs so their insights are obvious, engaging, and apparent to all.
KPIs should follow the SMART format, to ensure your KPIs meet this criterion.
What is a SMART KPI?
The letters typically stands for Specific, Measurable, Attainable, Relevant, Time-bound.
Which means:
- Is your objective Specific?
- Can you Measure progress towards that goal?
- Is the goal realistically Attainable?
- How Relevant is the goal of your organization?
- What is the Time-frame for achieving this goal?
The SMART criteria can also be expanded with the addition of evaluation and reevaluation.
KPIs should be understood by everyone within the organization. It’s essential that everyone in your business is aware of what you’re trying to achieve, and how you’re measuring progress towards those achievements.
Why it’s important to choose the right KPI?
Tracking metrics lets you improve overall results and align your people and processes with your organizational objectives, as well as giving you the following benefits:
- KPIs strengthen employee morale
Tracking KPIs can be about acknowledging employees hard work and securing their feeling of accountability and responsibility. When people feel responsible for KPIs, they are more likely to push themselves and receive more satisfaction from a job well done.
Allowing employees to monitor their performance and respond in the moment means that they are more likely to achieve their goals and better understand how to do so in the future.
- KPIs support and influence business objectives
It is important to communicate the business objectives across an organization. KPIs are important to business objectives because they keep objectives at the forefront of decision making.
- KPIs foster personal growth
With KPIs, teams are able to see exactly how they are performing at any given moment. When tracking the KPIs on a real-time KPI dashboard, you are able to ask questions like what, why, how, and when… and do so whenever. This makes learning from successes and failures a daily activity.
- KPIs are critical for performance management
This transparency ensures everyone is working in the same direction, which simplifies lines of communication. KPIs simplify performance management by allowing everyone to not only see what they’re doing, but what others are doing as well.
Conclusion:
By knowing how to create a KPI report and presenting this information in a logical, visually engaging format, you’ll provide a long-term solution for organizational improvement and growth.
A powerful KPI dashboard will provide a foundation for all your operational and strategic needs and development.
About the author
Everyone at BigRadar contributes to the blog.