How did Amazon work as a startup? What was there KPI for Sales?
This startup features Jeffrey P. Bezos, founder of Amazon.
He wanted Amazon to be “an everything store.”
Being launched in 1995 as a website that sold only books.
It is the largest online retailer in the world, Amazon operates a business model with many moving parts.
A percentage of products are offered to buyers through Amazon’s online storefront with a small markup, and inventory is kept in the company’s large network of warehouses.
The type of product it offers
- B2B – Amazon Web Services
- Ecommerce – Amazon.com
- Media – Amazon Prime
- Publishing – The Washington Post
In each instance, Amazon’s 4 pillar business model is responsible for its incredible growth and profits.
- Customer centricity
- Innovation
- Corporate Agility
- Continuous Optimization
The vision here was to build a customer-centric company. A place where people can come to find and discover anything they might want to buy online.
Jeffrey P. Bezos 9 advice for startups:
1. Be Stubborn and Flexible
“If you’re not stubborn, you’ll give up on experiments too soon. And if you’re not flexible, you’ll pound your head against the wall and you won’t see a different solution to a problem you’re trying to solve.”
He warns: “The thing about inventing is you have to be both stubborn and flexible, more or less simultaneously. The hard part is figuring out when to be which!”
2. Stick with Two Pizzas Rule
He believes in a “two pizza rule” for teams. According to the rule, every meeting should be small enough that attendees could be fed with two large pizzas.
If the group that’s gathered together to meet is too large, then nothing will get done.
When teams grow larger, they have a tendency to become less efficient
3. Never Stop Experimenting
It’s not an experiment if you know it’s going to work.
If you double the number of experiments you do per year you’re going to double your inventiveness.
These experiments are not always successful, of course. For example, the Amazon Fire mobile phone was a massive flop.
Bezos said about Prime:
“It’s an all-you-can-eat buffet, $79, that gives you free two-day shipping on everything you buy for a year. When you do the math on that, it always tells you not to do it.”
Prime has about over 3-5 million subscribers.
He says – “While costs associated with Amazon Prime memberships and other shipping offers are not included in marketing expense, we view these offers as effective worldwide marketing tools, and intend to continue offering them indefinitely.”
An experiment that worked really well for Amazon.
4. Be Willing to Invent
He says the words “pioneers” and “explorers” a lot to describe his team at Amazon.
Bezos is even an inventor himself. Like his 10,000 year clock, with the blue space company.
When you’re an entrepreneur, no matter what field, you have to love to invent and build things.
The love of brainstorming, experimenting, and toying are all fundamental characteristics of inventors and entrepreneurs.
5. Think Long Term
When asked about Amazon’s revenue growth, he said – “I’m thinking a few years out. I’ve already forgotten those numbers.”
He has said that those days were some of his most difficult. He was trying to raise $1 million to get Amazon started. He said he talked to 60 people, and 22 people gave him $50K.
The first question most of the investors had was ‘what’s the internet?
Bezos did, and he knew people would be buying products off of it. That’s his vision and long-term thinking at work.
If we think long term, we can accomplish things that we couldn’t otherwise accomplish.
– Jeff Bezos
6. Identify and Remove Risk
According to Bezos,
Good entrepreneurs don’t like risk, they seek to reduce risk.
Starting a company is already risky, and then you systematically eliminate risk step by step in those early days.
You kind of need to systematically identify risk and then as the company gets bigger and more robust, you can start taking risks again but in those early days a lot of it is about ‘okay I have a good idea, how do we reduce risk?’”
7. Get Started Now to Avoid Regret Later
While creating Amazon, Bezos was doing a good job on Wall Street. He had to make a decision of quitting the job to start working on Amazon.
He then created a framework to use for making the decision that he calls a Regret Minimization Framework.
This fear of regret is one of the key reasons why he decided to go ahead and start Amazon.
8. Obsess About Customers, Not Colleagues Or Competitors
Focusing on the customer makes a company more resilient.
He says:
We’re not competitor obsessed, we’re customer obsessed. We start with the customer and we work backwards.
Help Customers Avoid Accidental Duplicate Orders –
He noticed customers would accidentally order products they had previously purchased on Amazon.
So they decided to warn the customers about the similar purchase made before the same purchase was made.
Even though this reduced the sale, but the focus was on the fact that it would lead to greater customer loyalty.
9. Bezos Gives Entrepreneurs Advice
“Never chase the hot thing, you need to position yourself and wait for the wave.
And the way you do that is you pick something you’re passionate about.
Make sure it’s something you’re interested in, something you’re passionate about.
Missionaries build better products. I’d take a missionary over a mercenary any day. Mercenaries want to flip the company and get rich, missionaries want to build a great product or service – and one of those paradoxes is usually the missionaries end up making more money anyway. Pick something you’re passionate about.”
Start with the customer and work backwards. Those two things, passion and customer centricity, will take you an awful long way.
Jeff Bezos focused on the key performance indicator to create Amazon.
Important KPIs for an E-commerce business:
- Shopping cart abandonment rate
- Conversion rate
- Cost of customer acquisition
- Customer lifetime value
- Average order value
- Gross profit margin
What is KPI?
It is a numeric value that indicates whether your team/company is reaching its targets.
A Sales KPI is used by sales teams and by the top management to track the effectiveness of relevant sales activities within a company.
These measures help in optimizing your sales performance, sales funnel, and sales cycle length.
Types of KPIs –
- Business KPIs
- Financial KPIs
- Sales KPIs
- Marketing KPIs
- Project Management KPIs
What is KPI for Sales?

Without a regular physical presence in the field, it’s difficult to keep tabs on their team and business operations.
Sales KPIs are the metrics by which you will evaluate your team’s performance against your sales and organizational goals.
Popular sales KPIs:
- Monthly New Leads/Sales
- Lead-to-Customer Conversion Rate
- Cost per Acquisition
- Sales Qualified Leads (SQL)
- Customer Lifetime Value (LTV)
Why use a Key performance indicator for Sales?
Best Sales Goals = KPIs
- The sales team won’t know if their actions and efforts help them to improve results and achieve their goals.
- The sales manager can’t guide their team members and organization in the right direction.
- With the right KPIs, sales leaders and their teams can optimize their sales process.
- Sales managers use KPIs to help gauge the growth of the company.
- Overall visibility into your sales team’s performance.
- Track product performance against your sales and organizational goals.
- Optimize your sales funnel and sales cycle length.
Choosing and tracking the right KPIs for each member of your team is important.
Sales KPIs can help everyone on your sales team understand where they are and where they need to be for success.
25 Top Sales key Performance Indicators
1. Monthly Sales Growth
It gives you actionable insights you can use to optimize your sales processes, strategies, and product priorities.
To evaluate the monthly sales goals, track the number of monthly sales or as a percentage of monthly sales quota. You also need to track further indicators to find correlations between multiple sales and marketing processes.
Compare the monthly KPI’s to know the performance of sales, and look for the root cause of poor results.
2. Lead Generation
Understanding the percentage of leads your company is generating can keep your sales representatives motivated.
It also lets you make decisions based on your team’s performance.
This is mostly managed by the manager consistently.
Measure the current month’s new leads to previous time periods to see whether your marketing spend is justified.
3. Lead conversion rate
Lead conversion rate is an important performance indicator for your entire team.
Conversion rate KPI shows whether your sales team is capable of turning prospective deals into a real business.
Conversion rates can be used to compare the – Different outreach methods such as emailing or cold calling or face-to-face interactions.
There is always a reason why clients won’t convert into a paying customer. Find out the cause and improve the sales results by tackling the problem.
4. Lead Response Time
The time needed to convert prospects move through the sales funnel.
Get a clear picture of your sales pipeline and if you’re on track to hit your sales goals.
5. Cost per lead/conversion
Cost per Lead is calculated by summing up all your monthly marketing-related costs and dividing it by the number of monthly new leads. Decreasing cost per lead can be a sign of improved customer experience or increased brand awareness.
Cost per conversion is calculated as cost per lead, i.e all your monthly marketing costs and divide it by the number of monthly new customers/sales.
The cost per single conversion can be incredibly high.
6. Customer engagement level
A good customer relationship is important for a business. Salespeople can build trust and keep customers happy.
Make sure the salesperson is keeping a tally of the conversation with the customers. Then compare the number of touches to the average length of a client relationship.
keeping in touch with clients supports your business strategic goals as well — it’s a sales metric that matters.
7. Customer lifetime value/customer profitability
This KPI is calculated by combining the profit earned and the cost spent in association with a customer relationship.
The customer lifetime value is calculated to understand which client segment category brings in a higher profit.
It is basically knowing how much customer is worth to you based on their purchase.
8. Competitors Pricing
Being aware of their pricing can help create a competitive strategy.
You can consider a price-matching strategy incase your prices don’t differ much to ensure your customers the lowest prices.
Keeping track of the average retail price of your product, you can measure the impact of lowering your price or improvising it.
9. Sales by Contact Method
This KPI allows the sales team to monitor what products have better chances.
It includes the costs and time associated with each contact method.
The sales team can focus on what works and potentially think about phasing out from what simply isn’t working well.
10. Sales Volume by Location
This sales KPI tracks sales by specific regions.
The Sales process begins with knowing your ideal customers.
By comparing sales volumes across locations you’ll see where the demand for your product is highest and lowest.
Sales Kpi can be used to plan sales, to see how specific campaigns are doing and help sales managers optimize their targeting.
11. Sales Cycle Length
It is the average amount of time between the first interaction with a prospect to closing the deal.
The sales cycle length may vary depending on the type or source of lead. It can be segmented for more pinpointed insights.
It is an important metric to track in order to know how efficient your sales process is and help you forecast sales more accurately.
Once you have data on your KPIs, analyze the information to understand why you got those results.
12. Pipeline Velocity
It tracks the expected revenue from all active sales opportunities in a given timeframe.
A pipeline value is important because you achieve your target if you do not have sales deals in progress.
The Kpi also tracks the activity of the sales team.
13. Revenue Per Deal
Sometimes a sales manager is focused on closing the deal, rather than tracking how much revenue they bring per deal.
It is important to track revenue. This is not about the number of deals a sales manager closes but the quality of these deals.
14. Average Profit Margin
The KPI helps the sales team assess the profit margins for their products and services.
By understanding and tracking your average profit margin, it can help identify which products or offerings are truly the best for your bottom line.
It becomes more efficient to track when there are different products, dynamic pricing models, or if your sales reps have flexibility in giving discounts.
You can then utilize the average net margin along with the average number of monthly sales for one year to figure out how much you’re earning roughly every month.
15. Customer acquisition cost
Sales KPI tracks all the costs associated with bringing in a new customer.
Compare conversion rates to the number of prospects a sales rep reaches out to. If the conversions decrease after a certain number of touches, use this data to motivate your sales team for improvisation.
The data can also be used to compare different outreach methods, such as emailing or cold calling versus pursuing face-to-face interactions.
16. Average purchase value
This sales KPI tracks how much, on average, each customer purchases.
A higher average purchase value can offset a high customer acquisition cost as you’re able to spend more to acquire a higher value customer.
The sales KPI can be used to develop and optimize their sales process.
17. Retention and churn rates –
Also, known as customer turnover rate. This annual metric shows how many clients decide to stop using your service or product.
Sometimes the sales team is more focused on acquiring new customers, with much less effort centred around client satisfaction and retention.
There are three types if churns sales metrics:
- Revenue Churn: The percentage of monthly recurring revenue you lose from cancelled services.
- Customer Churn: The percentage of customers who leave your company in a given timeframe.
- Passive Churn: The percentage of customers who leave because of failed payments or expired payment methods.
To keep your churn rate low, provide excellent customer care and user experience, and be always ahead of your competitors.
18. Cannibalization Rate
It means measuring the percentage of new product sales that will replace existing product sales.
As your business releases new products, attention, and demand for existing products can decrease.
If a new product makes an existing one obsolescence, then you have some risk of alienating existing customers. It is one of the frequently overlooked but important sales metrics.
19. Close Rate Percentage
The ratio signals that either the leads coming in are not quality leads and/or that the sales team is spending far too much time trying closing each deal.
KPI finds the ratio between how many quotes your sales team sent out and how many deals they closed.
You want your close rate to provide valuable info so you can actually enhance your score and get great insights on lost deals and what should be done differently.
20. Sales Team Members Hitting Their Quotas
If less than 60% of your sales team has achieved the sales quota, it may be time to reevaluate your sales strategy. You want your quota to be difficult but not unreachable.
Each quarter takes the percentage of sales team hitting quota and base your new numbers off of that.
Reevaluate every quarter to ensure you have realistic and up-to-date numbers.
21. Net Promoter Score (NPS)
It is the measurement of how likely your product might be recommended by others.
Brand mentions online are often overlooked as an important sales metric.
There are three levels of customer advocacy:
- Promoters (score 9-10) – Drives you more sales and recommends your products to others.
- Passives (score 7-8) – are satisfied but unenthusiastic customers.
- Detractors (score 0-6) – are unhappy customers who spread negative information about your company and product.
To calculate your score, subtract the percentage of detractors from the percentage of promoters.
Compare the user experience over the months to know whether the sales is improving or getting worse.
22. Meeting Acceptance Rates –
Landing an appointment frequently is a sign of an exceptional sales rep.
This rate is calculated by dividing the number of meetings rep schedules by the total number of replies they receive from prospects.
It also tracks the metric for understanding both your sales reps incentives and the efficiency of your sales training, specifically when it comes to objection handling.
Website conversion rate shows the percentage of visiting customers who sign up for your service, create an account, or start a trial period.
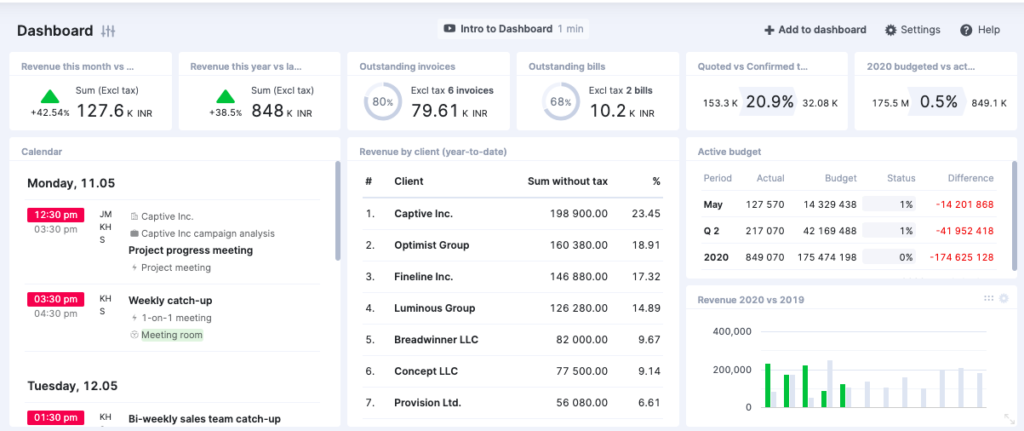
Measure and collect the sales KPIs that show relevant data
Collect the data on your dashboard, including the metrics that are part of your company’s narrative.
24. Upsell/Cross-Sell Rates
Upselling is encouraging customers to purchase a comparable higher-end product than the one in question.
And cross-selling invites customers to buy related or complementary items.
If both are used interchangeably the company can benefit from it.
Keep a track of the upsell and cross-sell numbers, and use that data to know when, how, what, and to whom your reps are upselling and cross-selling, and adjust your efforts accordingly.
25. Positive vs. Negative Reply Rates
It’s based on sentiment, not customer acquisition. That’s what differentiates this metric from others.
This metric can expose flaws and highlight benefits in aspects of your sales process.
It is the total number of prospects contacted.
The metric is expressed as a percentage — if 50 prospects were contacted and three responded positively, the positive reply rate is 6%.
How to choose the right sales KPIs for your business?
Different sales circumstances require a different set of performance indicators.
Leading indicators: KPI’s for funnel development
- Number of qualified leads in the pipeline
- Sales cycle length
- The total length of time to qualify a new prospect
- Qualified to proposal ratios
- Number of evaluations / shortlists per year
- Number of new (first) client meetings per month
- Cold lead to qualified ratios with conversion rates
Lagging indicators: Revenue and quota focused KPI
- Proposal for the closed ratio
- Average deal size
- Number of sales per year
- Annual quota
- New vs. existing client sales
KPI’s for Account Management and client retention/growth
- Average client growth year over year
- Client retention rates
Depending on your business, you may have additional KPIs to take into account.
Each should have an appropriate benchmark based on actual data and information from your sales history.
While there are plenty of sales KPIs that you can take into account, it is essential that you understand what each of the KPIs means and whether they are the right KPIs for your business and sales team.
About the author
Co-Founder @ BigRadar. Building conversational interfaces for small and large enterprises.